fig, axs = plt.subplots(ncols=3, figsize = (30,9))
plt.setp(axs.flat, xlabel='Value', ylabel='desirably')
NUM_COLORS = len(test_r)
cm = plt.get_cmap('gist_rainbow')#gist_rainbow viridis
[ax.set_prop_cycle('color', [cm(1.*j/NUM_COLORS) for j in range(NUM_COLORS)]) for ax in axs]
for r in test_r:
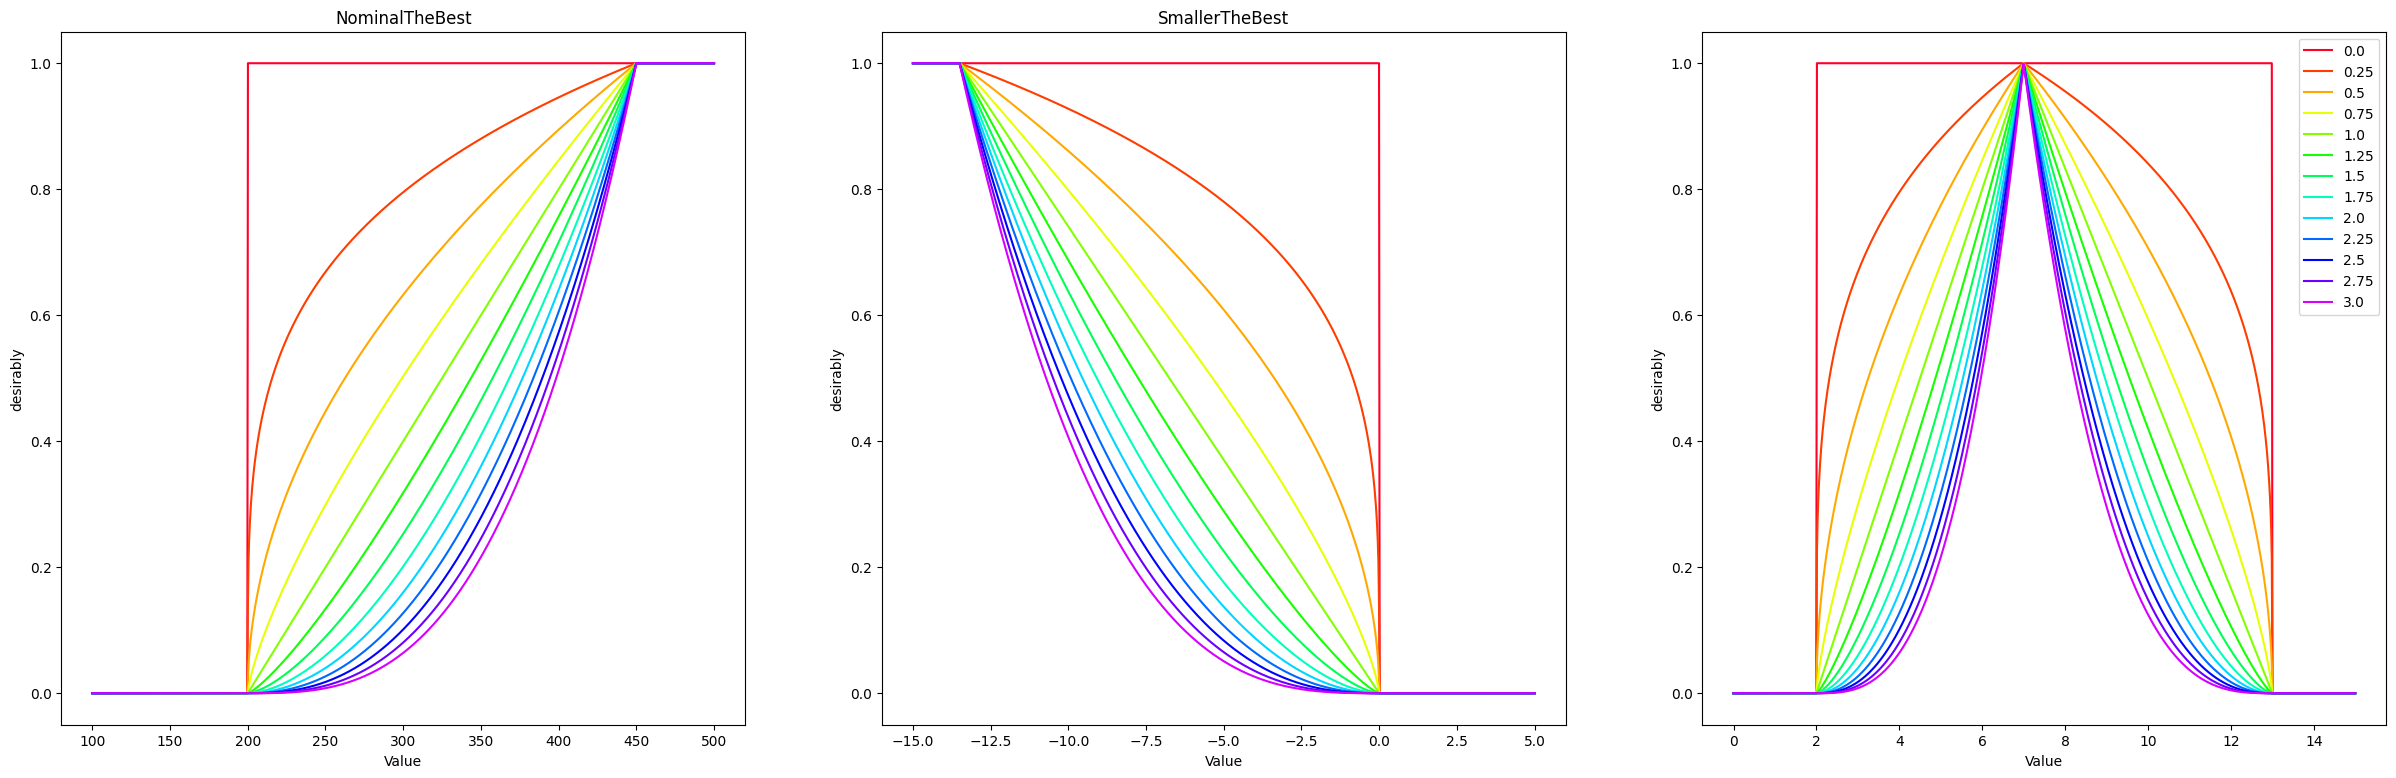
d1 = f1(Value = var1, LowerLimit = 200, Target = 450, r = r)
d2 = f2(Value = var2, Target = -13.5, UpperLimit = 0, r = r)
d3 = f3(Value = var3, LowerLimit = 2, Target = 7, UpperLimit = 13, r1 = r, r2 = r)
axs[0].plot(var1, d1, label = str(r))
axs[1].plot(var2, d2, label = str(r))
axs[2].plot(var3, d3, label = str(r))
plt.legend()
axs[0].set(title = 'LargerTheBest')
axs[1].set(title = 'SmallerTheBest')
axs[0].set(title = 'NominalTheBest')